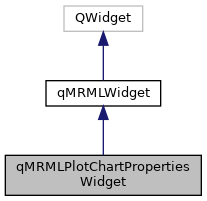
#include <Modules/Loadable/Plots/Widgets/qMRMLPlotChartPropertiesWidget.h>
|
| QScopedPointer< qMRMLPlotChartPropertiesWidgetPrivate > | d_ptr |
| |
| QScopedPointer< qMRMLWidgetPrivate > | d_ptr |
| |
◆ Superclass
◆ qMRMLPlotChartPropertiesWidget()
| qMRMLPlotChartPropertiesWidget::qMRMLPlotChartPropertiesWidget |
( |
QWidget * |
parent = nullptr | ) |
|
|
explicit |
◆ ~qMRMLPlotChartPropertiesWidget()
| qMRMLPlotChartPropertiesWidget::~qMRMLPlotChartPropertiesWidget |
( |
| ) |
|
|
override |
◆ mrmlPlotChartNode()
◆ seriesNodeAddedByUser
| void qMRMLPlotChartPropertiesWidget::seriesNodeAddedByUser |
( |
vtkMRMLNode * |
| ) |
|
|
signal |
Signal fired when the user adds a new plot series node to the scene using the widget's plot series selector.
◆ setAxisLabelFontSize
| void qMRMLPlotChartPropertiesWidget::setAxisLabelFontSize |
( |
double |
size | ) |
|
|
slot |
Change the font size of the labels of the axes.
◆ setAxisTitleFontSize
| void qMRMLPlotChartPropertiesWidget::setAxisTitleFontSize |
( |
double |
size | ) |
|
|
slot |
Change the font size of the title of the axes.
◆ setFontType
| void qMRMLPlotChartPropertiesWidget::setFontType |
( |
const QString & |
type | ) |
|
|
slot |
Change the type of font used in the plot.
◆ setGridVisibility
| void qMRMLPlotChartPropertiesWidget::setGridVisibility |
( |
bool |
show | ) |
|
|
slot |
Control the display of a grid in the chart.
◆ setLegendFontSize
| void qMRMLPlotChartPropertiesWidget::setLegendFontSize |
( |
double |
size | ) |
|
|
slot |
Change the font size of the legend of the plot.
◆ setLegendVisibility
| void qMRMLPlotChartPropertiesWidget::setLegendVisibility |
( |
bool |
show | ) |
|
|
slot |
Control the display of the legend in the chart.
◆ setMRMLPlotChartNode [1/2]
| void qMRMLPlotChartPropertiesWidget::setMRMLPlotChartNode |
( |
vtkMRMLNode * |
node | ) |
|
|
slot |
◆ setMRMLPlotChartNode [2/2]
◆ setMRMLScene
| void qMRMLPlotChartPropertiesWidget::setMRMLScene |
( |
vtkMRMLScene * |
newScene | ) |
|
|
overrideslot |
◆ setTitle
| void qMRMLPlotChartPropertiesWidget::setTitle |
( |
const QString & |
str | ) |
|
|
slot |
Set the title.
- See also
- TitleVisibility
◆ setTitleFontSize
| void qMRMLPlotChartPropertiesWidget::setTitleFontSize |
( |
double |
size | ) |
|
|
slot |
Change the font size of the title of the plot.
◆ setXAxisLabel
| void qMRMLPlotChartPropertiesWidget::setXAxisLabel |
( |
const QString & |
str | ) |
|
|
slot |
Set the label along the X-Axis.
- See also
- showXAxisLabel
◆ setXAxisLogScale
| void qMRMLPlotChartPropertiesWidget::setXAxisLogScale |
( |
bool |
| ) |
|
|
slot |
◆ setXAxisManualRangeEnabled
| void qMRMLPlotChartPropertiesWidget::setXAxisManualRangeEnabled |
( |
bool |
| ) |
|
|
slot |
◆ setXAxisRangeMax
| void qMRMLPlotChartPropertiesWidget::setXAxisRangeMax |
( |
double |
| ) |
|
|
slot |
◆ setXAxisRangeMin
| void qMRMLPlotChartPropertiesWidget::setXAxisRangeMin |
( |
double |
| ) |
|
|
slot |
◆ setYAxisLabel
| void qMRMLPlotChartPropertiesWidget::setYAxisLabel |
( |
const QString & |
str | ) |
|
|
slot |
Set the label along the Y-Axis.
- See also
- showYAxisLabel
◆ setYAxisLogScale
| void qMRMLPlotChartPropertiesWidget::setYAxisLogScale |
( |
bool |
| ) |
|
|
slot |
◆ setYAxisManualRangeEnabled
| void qMRMLPlotChartPropertiesWidget::setYAxisManualRangeEnabled |
( |
bool |
| ) |
|
|
slot |
◆ setYAxisRangeMax
| void qMRMLPlotChartPropertiesWidget::setYAxisRangeMax |
( |
double |
| ) |
|
|
slot |
◆ setYAxisRangeMin
| void qMRMLPlotChartPropertiesWidget::setYAxisRangeMin |
( |
double |
| ) |
|
|
slot |
◆ d_ptr
| QScopedPointer<qMRMLPlotChartPropertiesWidgetPrivate> qMRMLPlotChartPropertiesWidget::d_ptr |
|
protected |
The documentation for this class was generated from the following file:


 Public Types inherited from qMRMLWidget
 Public Slots inherited from qMRMLWidget
 Signals inherited from qMRMLWidget
 Public Member Functions inherited from qMRMLWidget
 Protected Attributes inherited from qMRMLWidget
 Static Public Member Functions inherited from qMRMLWidget
 1.8.14